
CURE: A Predictive Model for Story Points
Story points were intended to reduce estimation anxiety. Instead, they became the most contested number in software delivery. The failure is not in the abstraction itself — it’s in what we never made explicit. Teams already estimate far more than effort. They account for learning, fragility, and people — but do so implicitly, inconsistently, and without a shared language. CURE is a proposal to make those forces explicit.
ITSCRUMAGILE
Sunny
1/22/20265 min read


CURE: A Predictive Model for Story Points
Story points were intended to reduce estimation anxiety.
Instead, they became the most contested number in software delivery.
The failure is not in the abstraction itself — it’s in what we never made explicit.
Teams already estimate far more than effort.
They account for learning, fragility, and people — but do so implicitly, inconsistently, and without a shared language.
CURE is a proposal to make those forces explicit.
The CURE Model
We propose predicting story points using four observable dimensions:
SP = C × (U + R + E)
Where:
C — Capability
U — Uncertainty
R — Risk
E — Effort
Story points are no longer assigned.
They are derived.
This makes the estimate explainable, auditable, and improvable.
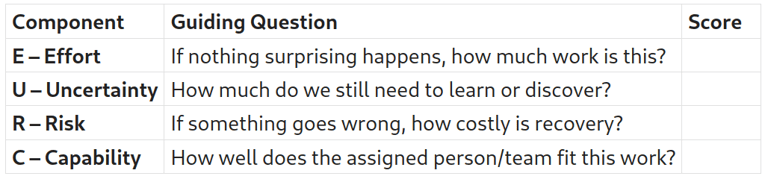
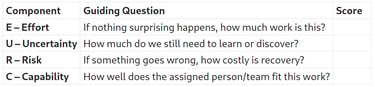
What Each Dimension Represents
Effort (E)
The work required assuming nothing surprising happens.
Effort answers:
“What do we have to build?”
“How much focused work is involved?”
Effort is usually the smallest and least volatile component.
Uncertainty (U)
The cost of not knowing yet.
Uncertainty answers:
“What must we discover before progress stabilizes?”
“What assumptions might collapse once we start?”
Examples:
New technology
Poorly understood domain rules
Ambiguous requirements
Unknown data shapes
Uncertainty shrinks with learning — if the system allows learning.
Risk (R)
The cost of being wrong.
Risk answers:
“What breaks if this goes wrong?”
“How expensive is recovery?”
Examples:
Schema changes
Distributed side effects
Security / billing / compliance paths
Fragile integrations
Risk does not correlate with effort.
It correlates with blast radius.
Capability (C)
The predictability modifier.
Capability answers:
“How well does the person (or team) match this work?
This includes:
Familiarity with the codebase
Domain knowledge
Tooling experience
Team stability
C is multiplicative because it amplifies everything else.
This is not a judgment of individuals — it is a situational modifier.
From Structural Precision to Mathematical Precision
At first, CURE is intentionally structurally precise, not numerically rigid.
But it can become mathematically precise within a specific organization by introducing a fifth variable:
M — Organizational Maturity
SP = C × (U + R + E) × M
M represents how reliably an organization turns intent into outcome under normal operating conditions.
It may also vary over time as those conditions change.
This is where estimation stops being philosophical and becomes operational.
In practice, CURE does not generalize across organizations by default — the value of M must be discovered empirically through use.
What M Represents (Examples)
Maturity reflects factors like:
Delivery pipeline stability
Test automation coverage
Deployment frequency
Incident recovery time
Cross-team dependencies
Attrition and onboarding churn
Planning interruption rate
Two teams with identical CURE inputs will produce very different outcomes depending on M.
This is why estimation accuracy varies wildly across organizations — even with “the same” practices.
A Starting Point for M
We are not proposing a new maturity model.
Existing frameworks (for example, those from the CMMI Institute) already describe organizational capability at a high level.
CURE does not replace them — it grounds them in delivery math.
Organizations could initially:
Assign coarse maturity bands
Use historical predictability deltas
Adjust M empirically over time
The point is not the number.
The point is what the number makes visible.
Why This Matters More Than Better Estimates
When estimates and actuals diverge today, we argue about accuracy.
With CURE, divergence becomes diagnostic.
Teams can ask:
Did uncertainty resolve slower than expected?
Did risk materialize?
Did capability change (attrition, reassignment)?
Did maturity degrade (incidents, interruptions)?
Instead of blame, we get causal explanations.
Instead of “work harder,” we get:
Reduce risk
Improve learning loops
Stabilize teams
Invest in systems, not pressure
This is where estimation turns into leadership instrumentation.
Scenarios CURE Can Explain
Why a low-effort change exploded late
Why velocity dropped after key people left
Why upskilling didn’t improve predictability
Why retention mattered more than tooling
Why some teams feel “slow” but are actually safer
CURE doesn’t just estimate work — it explains outcomes.
An Open Invitation to the Industry
We deliberately stop short of prescribing:
Exact numeric scales
Universal weights
Cross-company benchmarks
Those must emerge from practice, not theory.
The proposal is simple:
Use a shared structure.
Discover your own constants.
Learn from the gaps.
If enough teams experiment, compare, and publish findings, CURE becomes something rare in software estimation:
A model that improves as it is used.
CURE Estimation Worksheet (Draft v0.1)
Purpose: Predict story points by making uncertainty, risk, and capability explicit.
Step 1 — Describe the Work
Story / Task name:
Brief description:
Who is expected to do the work:
Step 2 — Score the Components (Relative, Not Absolute)
Use relative integers (e.g., 1–5).
Numbers only matter within your team.
Step 3 — Calculate Predicted Story Points
SP = C × (U + R + E)
This is a prediction, not a commitment.
Step 4 — Capture Assumptions (Critical)
Key uncertainties assumed:
Risks we are accepting:
Capability assumptions (experience, availability, stability):
Step 5 — Post-Completion Reflection (Later)
After the work is done:
Actual outcome vs expected:
Which factor changed the most?
☐ C ☐ U ☐ R ☐ E
What should we adjust next time?
This is where learning happens.
About the Worksheet and Calculator
The worksheet shown above is the conceptual core of CURE.
It is intentionally tool-agnostic and designed to work in conversation, planning sessions, or retrospectives.
We are also developing a public Google Sheet that implements this worksheet as a calculator.
That sheet will evolve as teams experiment and share what works for them.
The latest version will always be available at:
(link coming shortly — this post will be updated)
The worksheet defines the structure.
The calculator explores the math.
Closing Thought
Story points failed not because teams misunderstood them,
but because we asked a single number to quietly absorb effort, uncertainty, risk, and people.
CURE does the opposite.
It makes those forces explicit, discussable, and therefore improvable.
Not to promise perfect prediction — but to explain why outcomes diverge, and where improvement actually belongs.
Acknowledgement
This work was inspired by a 2020 essay by Tim Ottinger, whose writing on estimation, uncertainty, and predictability articulated patterns many software teams experience but rarely name.
CURE is not an argument against that work.
It is an attempt to make those underlying forces explicit, measurable, and open to shared learning.
References
Estimates vs Actuals by Tim Ottinger, Senior Consultant, Edinburgh, Scotland - UK
https://www.industriallogic.com/blog/estimates-vs-actuals/
If this article resonated with you 👉 Buy me a coffee
Only interested in new Articles
© 2025. All rights reserved.
For Discussions/Suggestions/Community
Be part of an engaging community where we discuss topics ranging from AI to Agile, Scrum practices, and software development challenges. Whether you’re looking to share your insights, ask questions, or simply keep up with the latest conversations, our Google Group is the place to connect.